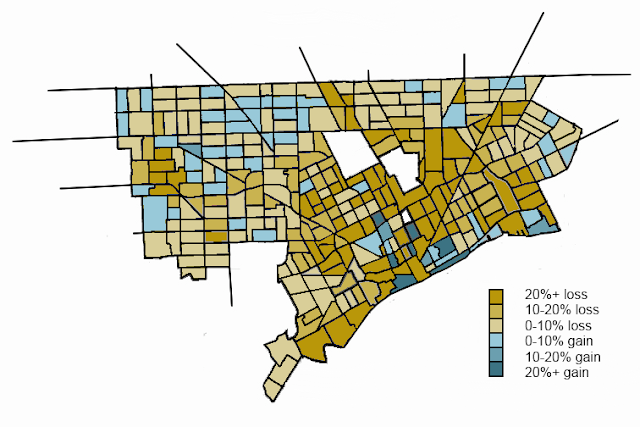
In an earlier post, I posted maps of how Detroit's population changed through the decades, but how much of those changes were the result of changes in household sizes? This post should clear that up, by looking at changes in households (or occupied housing units) by decade at the census tract level.
1940s. Downtown wasn't really growing - and by most definitions of what downtown includes - was seeing a decline in occupied units. The decline was still pretty moderate though with small pockets of growth mixed in. The older early 20th century neighbourhoods like Poletown, Jefferson-Chalmers, SW Detroit and Dexter-Linwood were still experiencing slow household growth even though the population was declining. This means household sizes were experiencing significant decreases. On the other hand, predominantly black neighbourhoods around Hastings Street didn't experience household growth even though they experienced population growth, pointing to increasing household sizes. Outer Detroit was still growing rapidly.
1950s. Many of the central neighbourhoods begin to experience significant decline. However, the Woodward and Cass corridors of Downtown and Midtown seem to have experienced a significant increase in households despite experiencing a large decrease in population. In 1950, several census tracts there had a ratio of population to housing units well above what would be expected of conventional households. By 1960 the population:housing units ratio was more normal. I'm not sure what the story here is... Perhaps there was a large homeless population that was relocated or rooming houses that were replaced by more conventional units? Although outer Detroit was still growing in households (but not always in population), most of the early 20th century neighbourhoods switched into moderate household decline.
1960s. Interestingly, many of the early 20th century neighbourhoods seem to have stabilized. Although the 12th street area where much of the rioting of 1967 took place saw a decrease in households, many nearby neighbourhoods like around Dexter Ave saw an increase in households. However, the innermost parts of the city continued to decline, and the 1950s increase in households that occurred around the Woodward/Cass corridor began to reverse. The outer neighbourhoods were still experiencing household growth, but that was slowing down as they were largely built out by this point.
1970s.With a few exceptions, most of the core is experiencing rapid decline in households, as are much of the early 20th century neighbourhoods. Most of the outer neighbourhoods are flat-lining at this point, still relatively stable but not growing much, although there are a few exceptions like Grandale which experienced moderate household decline.
1980s. A few outlying neighbourhoods begin to decline like the Gratiot-6 Mile area and Brightmoor. The downtown starts seeing more areas of growth.
1990s, some of the outer Detroit neighbourhoods that started to decline in the 80s see accelerating decline, notably Brightmoor. However, many outer Detroit neighbourhoods are still pretty stable. Some of the more close in areas actually experience a decrease in the rate of decline.
2000s. Pretty much everywhere sees the rate of decline increase except for the inner core. The neighbourhoods that were stable in the 90s experience moderate decline, just about everywhere else experiences rapid decline.


Original map from: https://detroitography.com/2012/10/17/de-troit-a-la-mondrian/
ReplyDelete